 Entrar
F1 Tyre Stints 2026: Hards Ran 24 Laps, Softs Just 14
Three compounds, three very different lifespans, and one number that looks too good to be true.
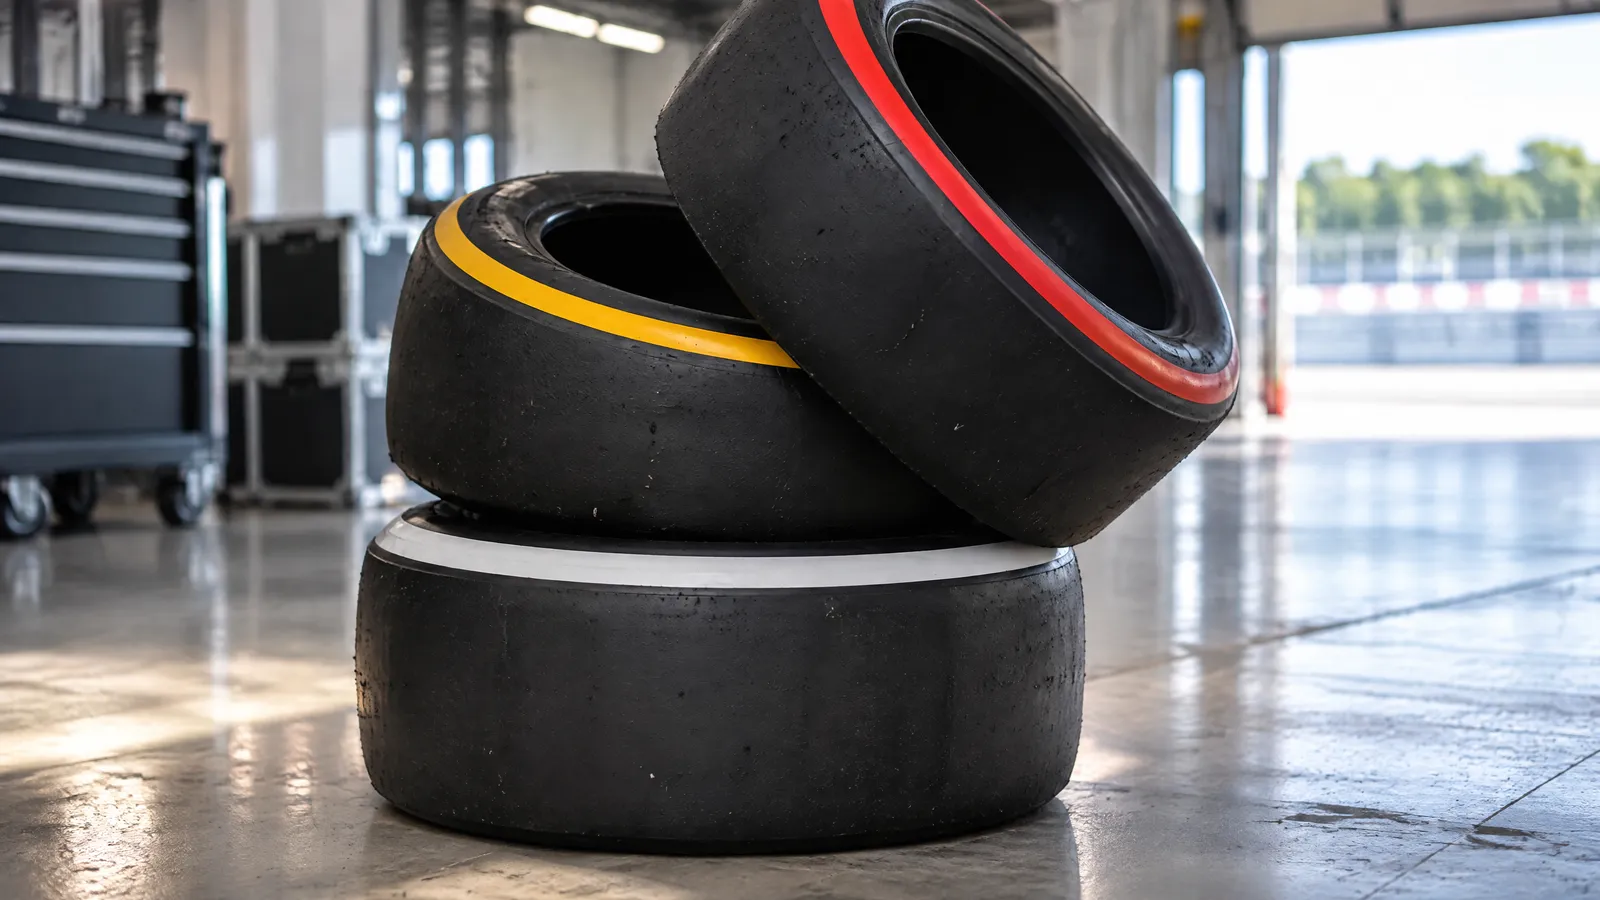
Key takeaways
- Hards averaged 24.3 laps per stint in 2026, mediums 18.9 and softs 14.3, across 1,073 slick stints in GridRaces data.
- Hards covered 40.5% of slick racing laps, mediums 33.2% and softs 26.2%.
- Drivers started 375 soft stints against 340 on hards, because stints end for track position as much as for tyre wear.
- Intermediates averaged just 8.4 laps over 65 stints.
- Stint length is not tyre life: pit stops are driven by safety cars, undercuts and strategy.
F1 tyre stints 2026 tell a clean story at the top level: across the 1,073 slick-tyre stints GridRaces has logged this season, hards averaged 24.3 laps, mediums 18.9 and softs 14.3. That is a hard stint 1.7 times longer than a soft one. The surprise is that drivers still started more stints on softs (375) than on hards (340), which says more about strategy than about rubber.
What do F1 tyre stints 2026 look like by compound?
Here is the season in one table, built from every dry-tyre stint in the GridRaces stints data for the 2026 season.
| Compound | Stints | Total laps | Average stint | Longest logged |
|---|---|---|---|---|
| Hard | 340 | 8,267 | 24.3 laps | 55 |
| Medium | 358 | 6,780 | 18.9 laps | 60 |
| Soft | 375 | 5,345 | 14.3 laps | 61 |
| Intermediate | 65 | 546 | 8.4 laps | 17 |
Hards carried 40.5% of all slick racing laps, mediums 33.2% and softs 26.2%. Intermediates, the wet-weather option, covered 546 laps in 65 stints, and their short average (8.4 laps) fits what they are for: bridging a track that is drying or drying out, not running to the end.
A caution on the table. Seven stints in our data have no compound recorded, so they are left out, and we have not tried to guess them. The longest logged stints (55, 60 and 61 laps) are also worth a raised eyebrow. A 61-lap soft stint is more likely to reflect neutralised running, a red flag restart or a data quirk than a tyre that really lasted that long, so we flag it rather than celebrate it.
Why do softs get used more often than hards?
Because a stint is a decision, not a measurement. A stint ends when a driver pits, and drivers pit for track position, an undercut, a safety car window or a puncture as often as for worn tyres. Our earlier piece on safety cars in 2026 counted 35 neutralisations in 17 rounds. Every one of those is a chance to swap tyres cheaply, and a cheap stop usually means a fresh set of softs or mediums rather than a long hard stint.
Softs are also the natural choice for the first and last phase of a race: grip off the line, then a late push when cars are light. A short, sharp soft stint is a tool, not a failure. The 375 soft stints are not 375 tyres that gave up, they are 375 chances someone chose to use grip over durability.
What does the 1.7 ratio actually tell us?
The hard-to-soft ratio of 24.3 to 14.3 laps is the best simple read of the compounds' relative life that we can build from this data. It lines up with the intuition that the hardest compound lasts longest, which is reassuring for a first look. It does not tell us how fast each compound was on lap 12 or lap 22, because we are counting laps on tyre, not lap time. For that you need the lap-by-lap view in telemetry.
It also hides circuit effects. A 24-lap average across a season includes the rounds where a one-stop was the norm and the rounds where drivers were stopping every dozen laps. Our Brazilian Grand Prix tyre strategy piece is a clean example of how two stops could beat three at one track while the season average says nothing about it.
Can we say the average stint is changing over the season?
Not from this table. We have not split the season into early and late halves, so we will not claim a trend, and a season average blends one-stop races with races where drivers pitted every dozen laps. What we can say is simpler: the three slick compounds sit in a clear order of life, and the gap between them is wide enough that no strategist can ignore it.
If you want to see how that plays out for one driver, the stint view in telemetry shows every run lap by lap, with the compound and the tyre age at the start. It is the quickest way to spot a driver who made a long hard stint work, or one who burned through two sets of softs and still made up places.
The verdict
The 2026 tyre story is not that hards last longest. It is that drivers keep choosing shorter stints anyway, because a fresh set of softs in the right window is worth more than a longer run on a harder tyre. The takeaway for Las Vegas, where cold conditions will limit warm-up on every compound: expect the most interesting stint to be the first one after any neutralisation.
You can follow every stint of the weekend live on the live page, and our analysis section will keep adding studies like this one. When the chequered flag drops, put your Energy on the strategy you think wins it on the predict page.
- Hard (avg laps)
- 24.3
- Medium (avg laps)
- 18.9
- Soft (avg laps)
- 14.3
- Intermediate (avg laps)
- 8.4
| Pos | Driver | Laps run |
|---|---|---|
| 1 | Hard | 8,267 |
| 2 | Medium | 6,780 |
| 3 | Soft | 5,345 |
Frequently asked questions
Which F1 tyre compound lasts longest in 2026?
In GridRaces data the hard compound has the longest average stint at 24.3 laps, ahead of the medium at 18.9 and the soft at 14.3. Stints end for strategic reasons too, so this is a guide to tyre life, not a precise measure.
How many stints did drivers run on each compound in 2026?
The data logs 340 hard, 358 medium and 375 soft stints, plus 65 on intermediates, for the 2026 season. Seven stints with no compound recorded are excluded.
Why is the longest soft stint 61 laps?
A figure that long is more likely to reflect neutralised running, a red flag or a data quirk than normal tyre life. We flag it and do not rely on it.
Related
F1 Track Temperature 2026: Do Cold Races Stretch Stints?
The three coldest races averaged 23.7 laps a stint, the five hottest 20.8. What GridRaces weather data says before Las Vegas.
F1 Qualifying Evolution 2026: How Much Faster Is Q3?
Across 19 rounds the best Q3 lap beat the best Q1 lap by 1.09s on average. Belgium gained 1.50s, Canada 0.80s.

Safety Car 2026: 13 Deployments, 22 VSCs and One Quiet Race
13 safety cars and 22 VSCs in 17 rounds, then none in Brazil. What the 2026 race-control logs say before Las Vegas.